
Scenario builder
Answer the structure questionbefore it is asked.
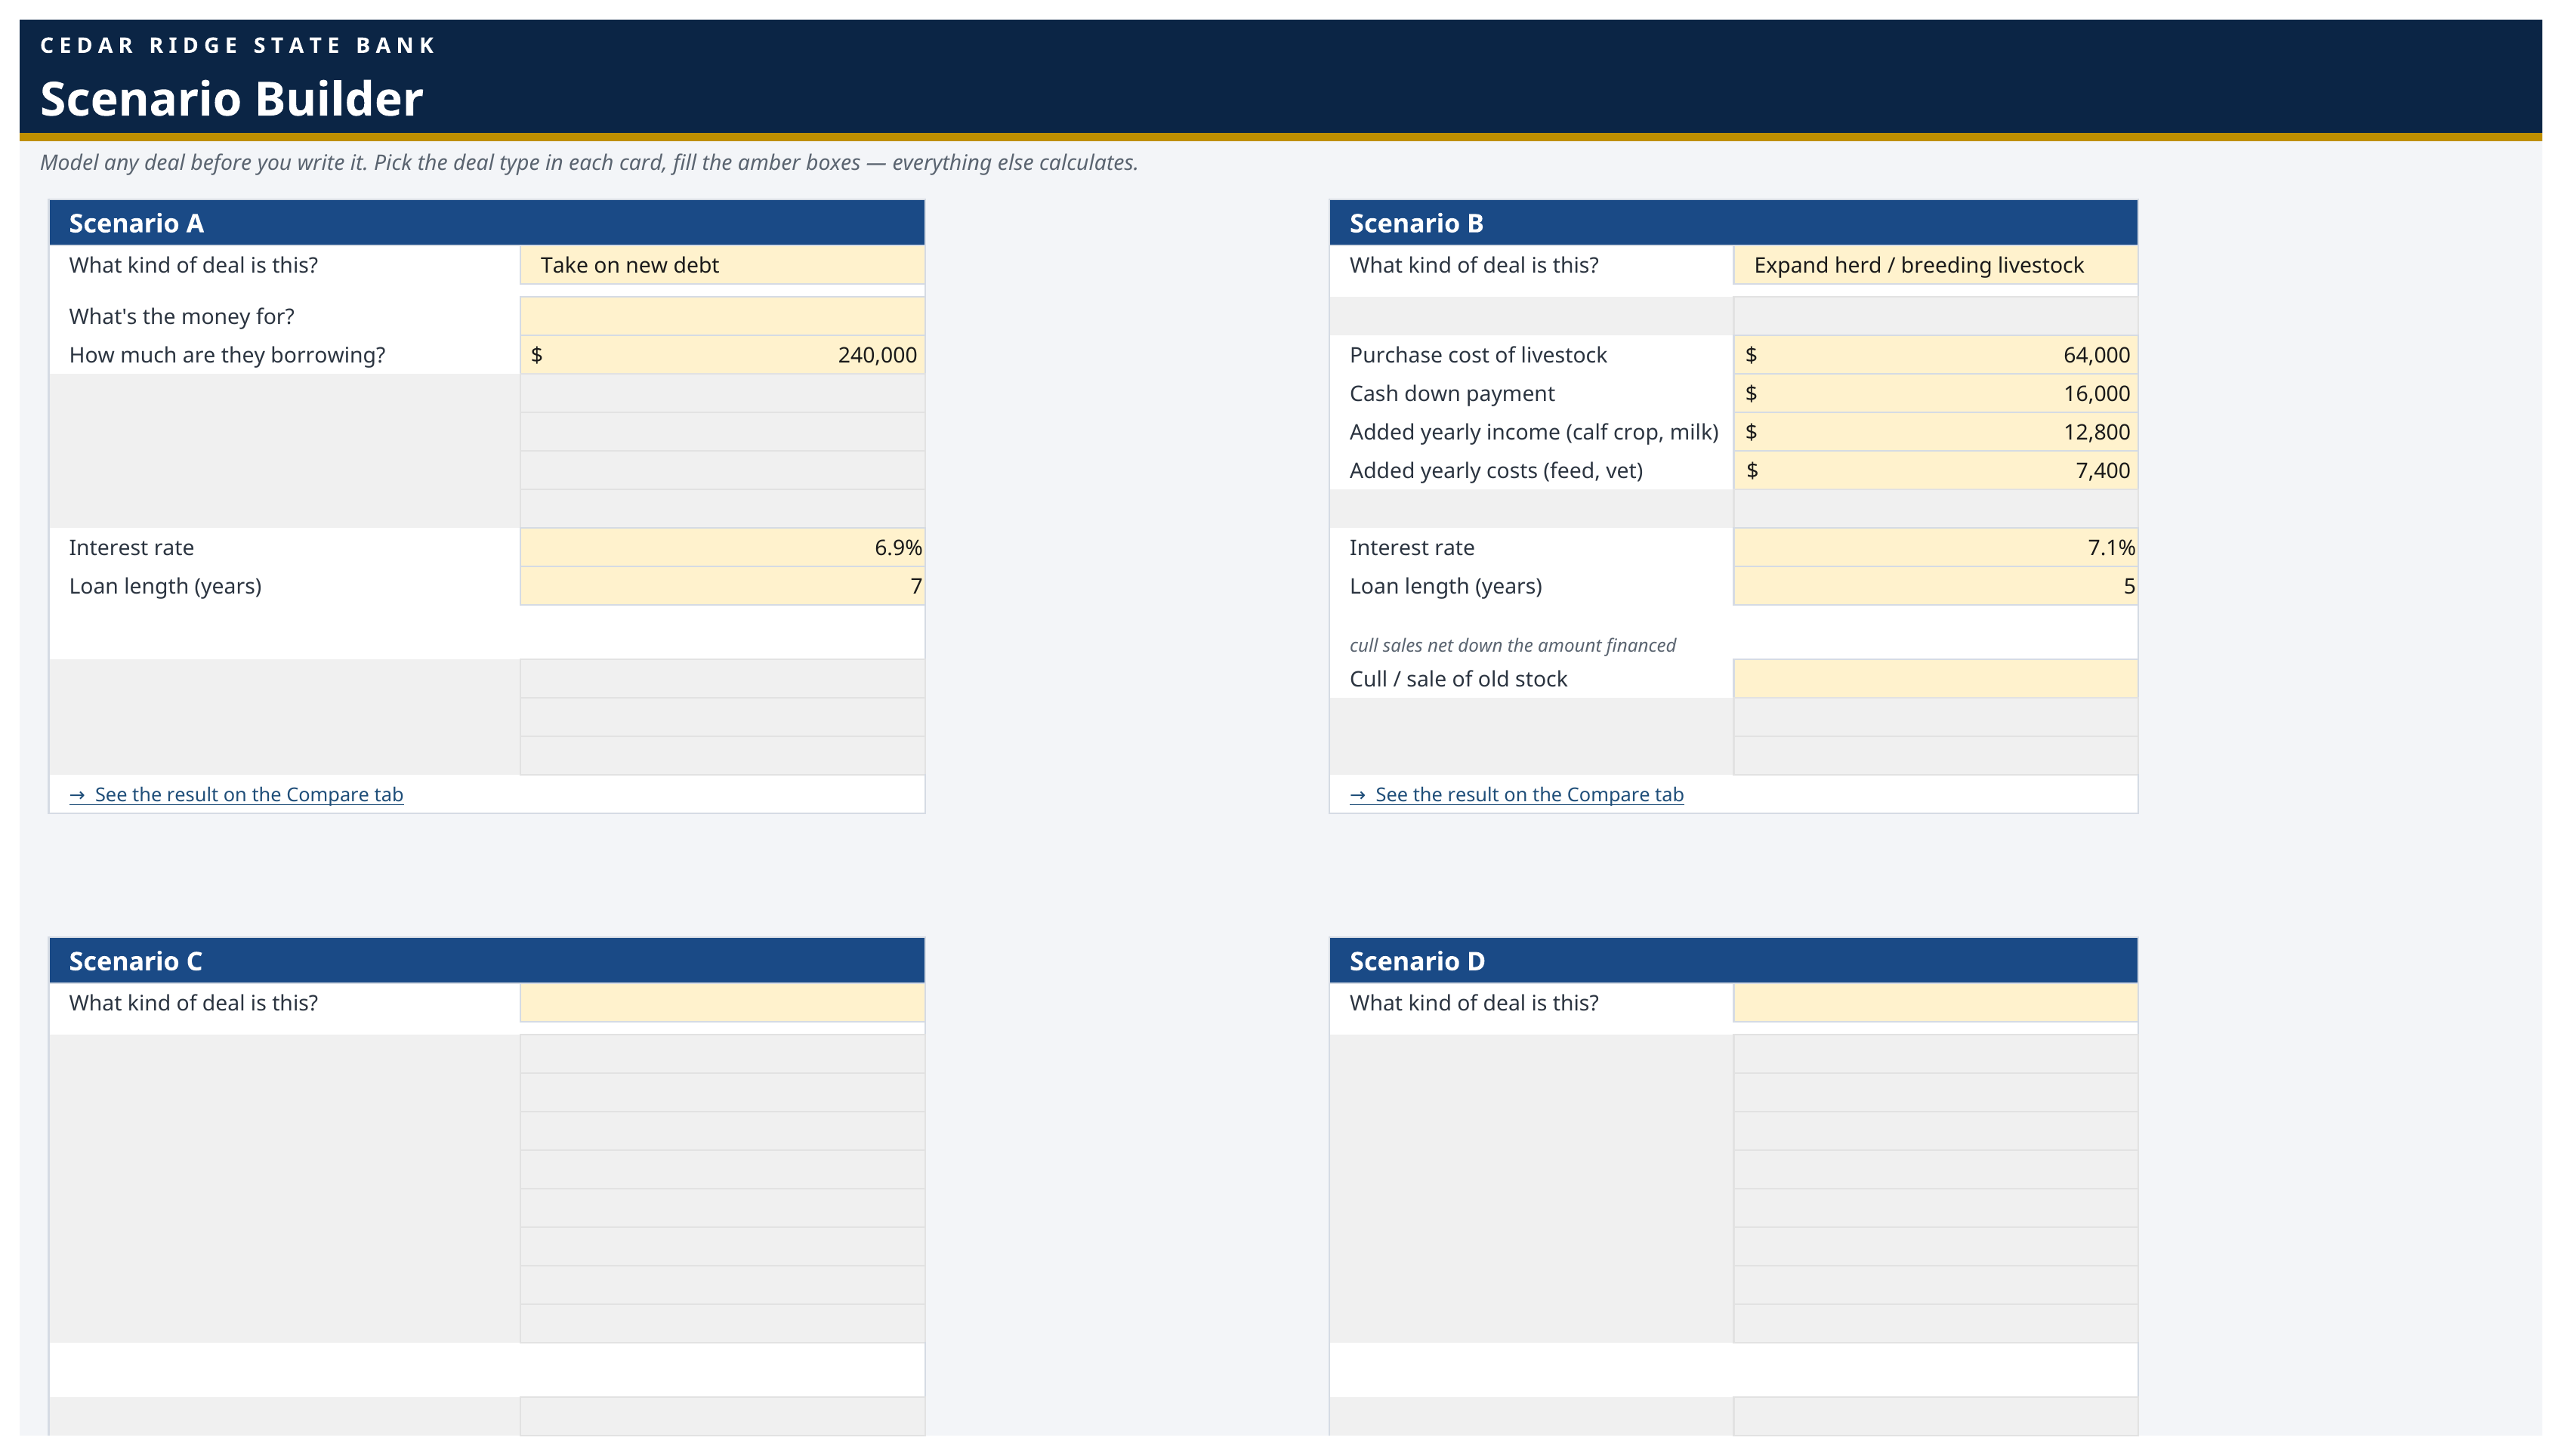
Build several versions of the same request and compare them on one page. Each scenario is graded against the same policy limits, and the page shows exactly what moved on the balance sheet to get there.
- Side by sideStructures compared on one page
- GradedEach scenario against the same limits
- TraceableWhat moved, and by how much
Try the question
Move the request and watch the grade move
Rate, revenue, and new debt change the coverage and the leverage. The workbook runs this across every structure at once.
Move the request
- Debt service coverage
- 1.85x
- Policy minimum 1.25x
- Debt to EBITDA
- 3.09x
- Policy maximum 3.50x
Result: Within policy limits
Illustration on sample figures. Your bank sets its own limits on the policy tab.
What this review covers
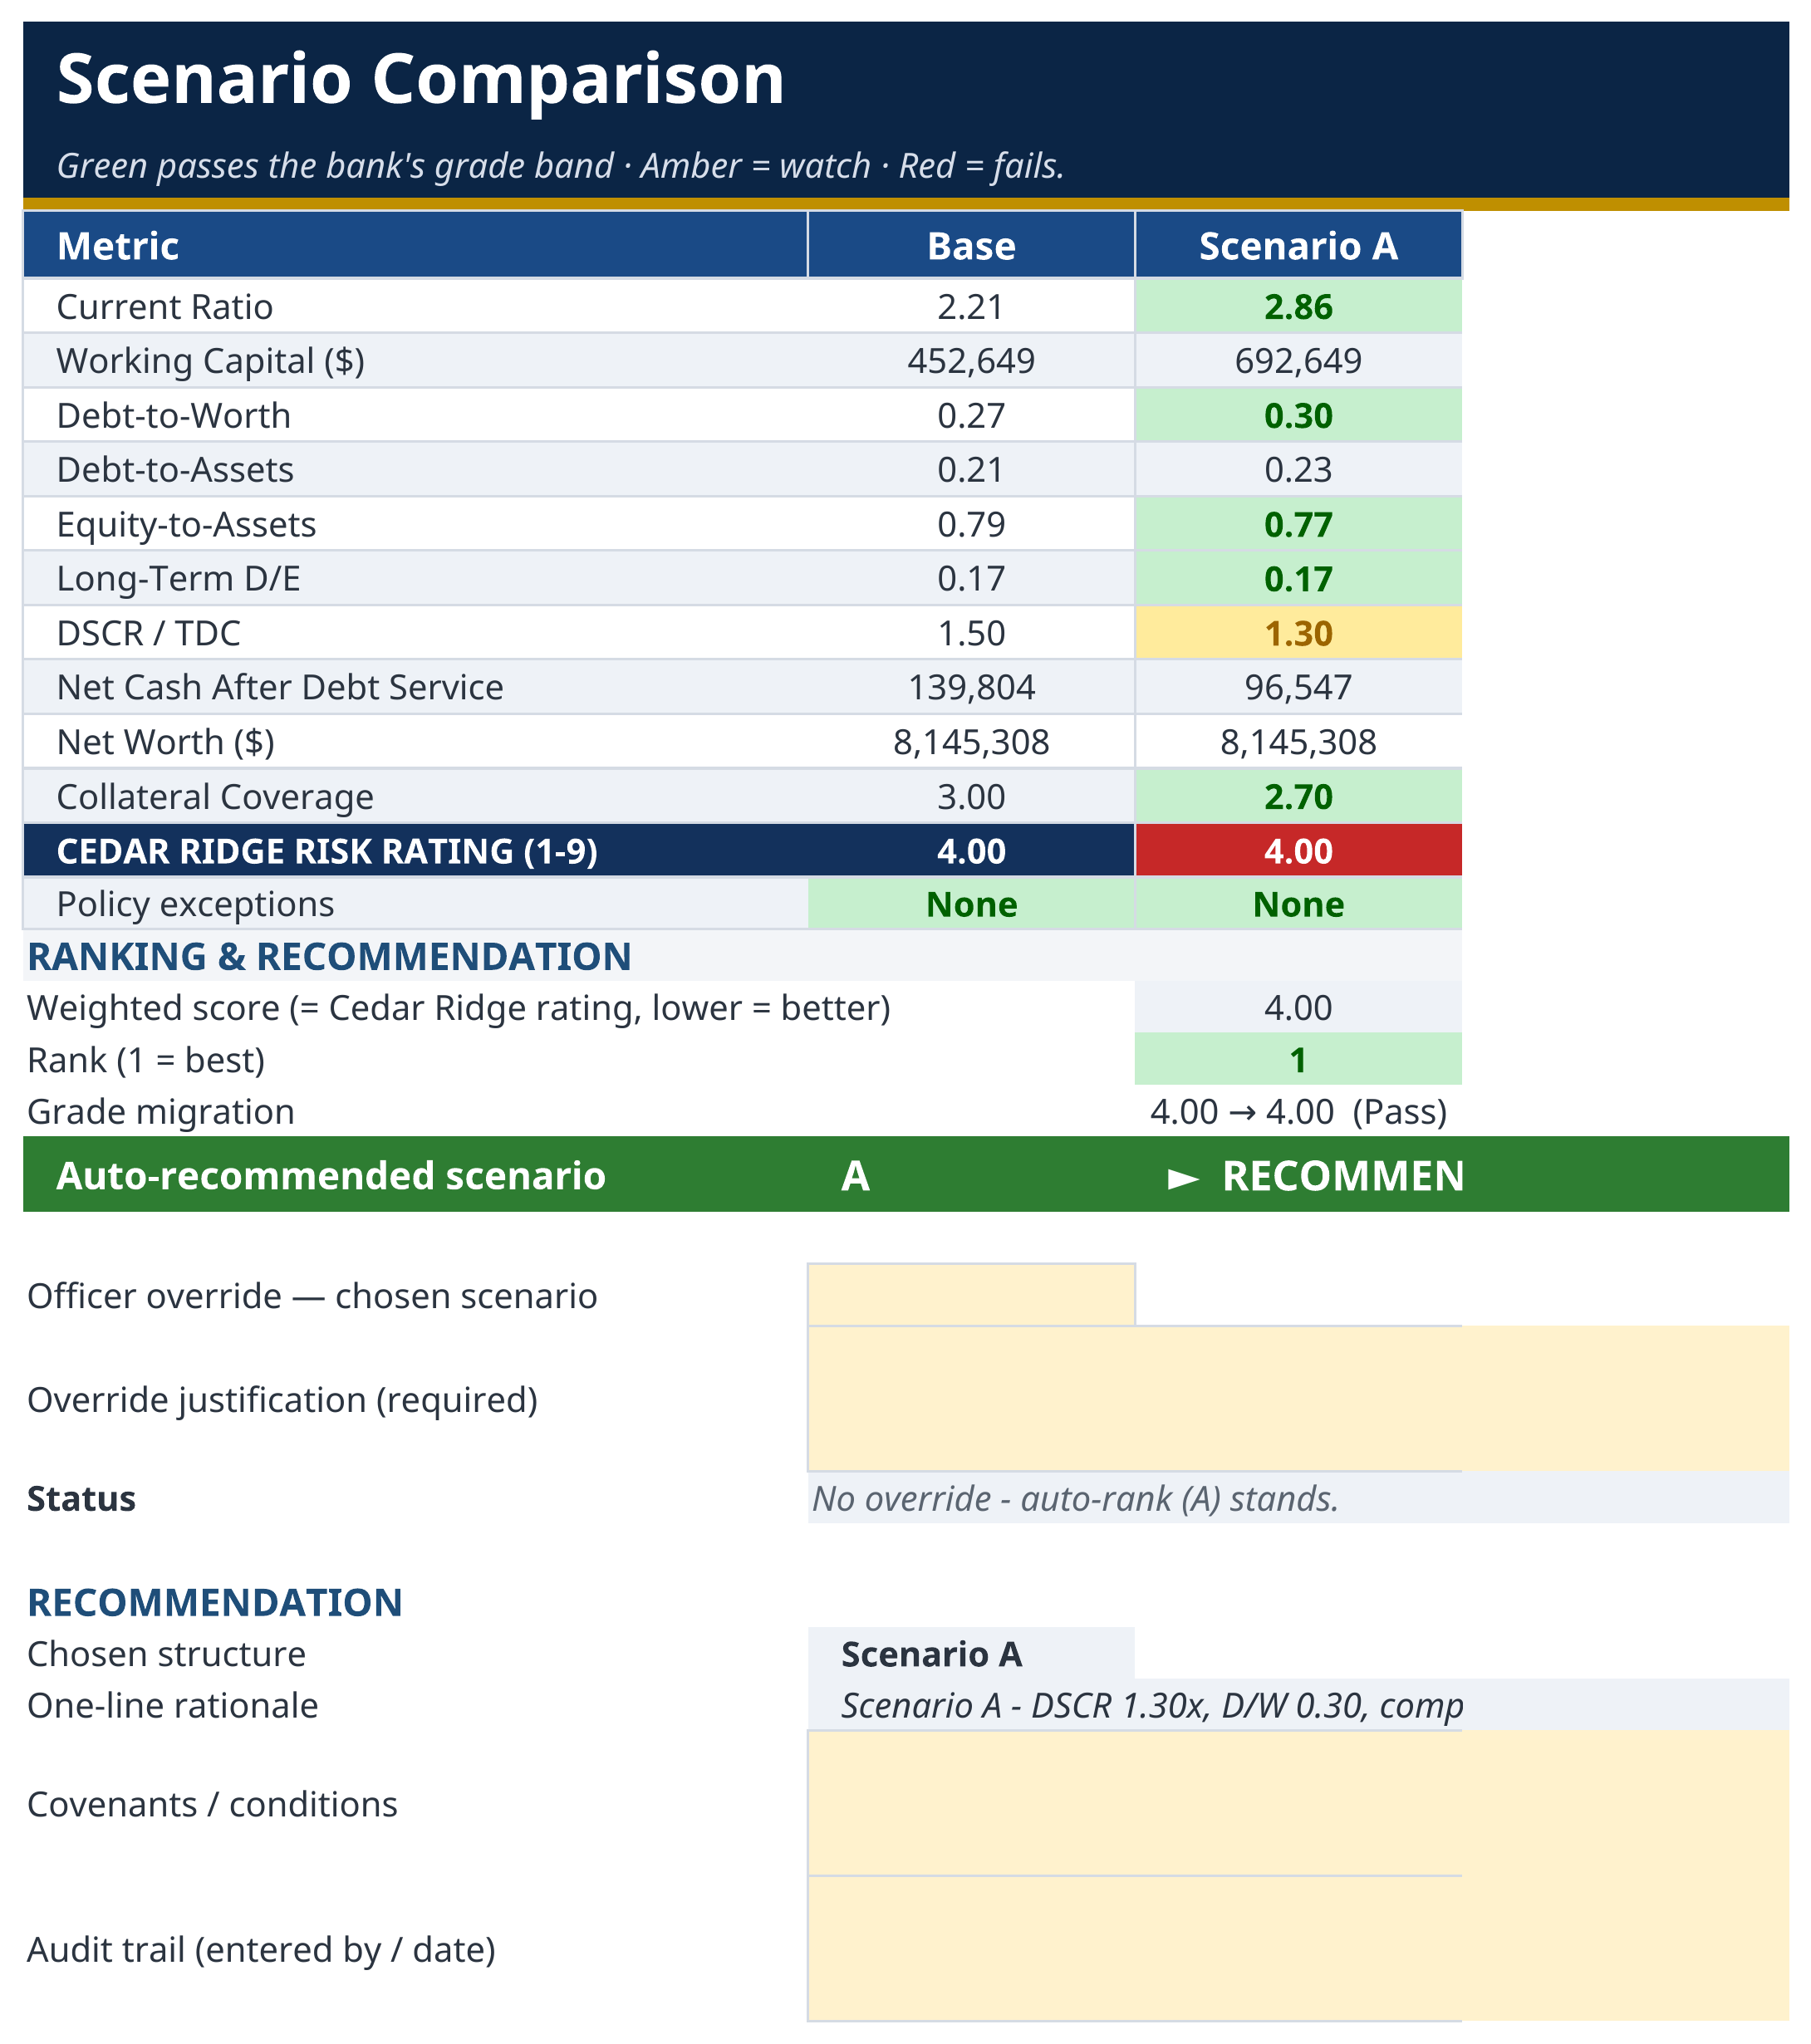
Green, amber, red at a glance
Every scenario is scored against the bank's own policy limits, so the structure conversation starts from which options actually pass.
Sources and uses on the same page
The comparison shows the assets added, the debt added, and the equity involved in each version, rather than leaving the difference implied.
Limits, not guesses
The page reports the maximum debt and the minimum position that still clear policy, which turns the negotiation into a number.
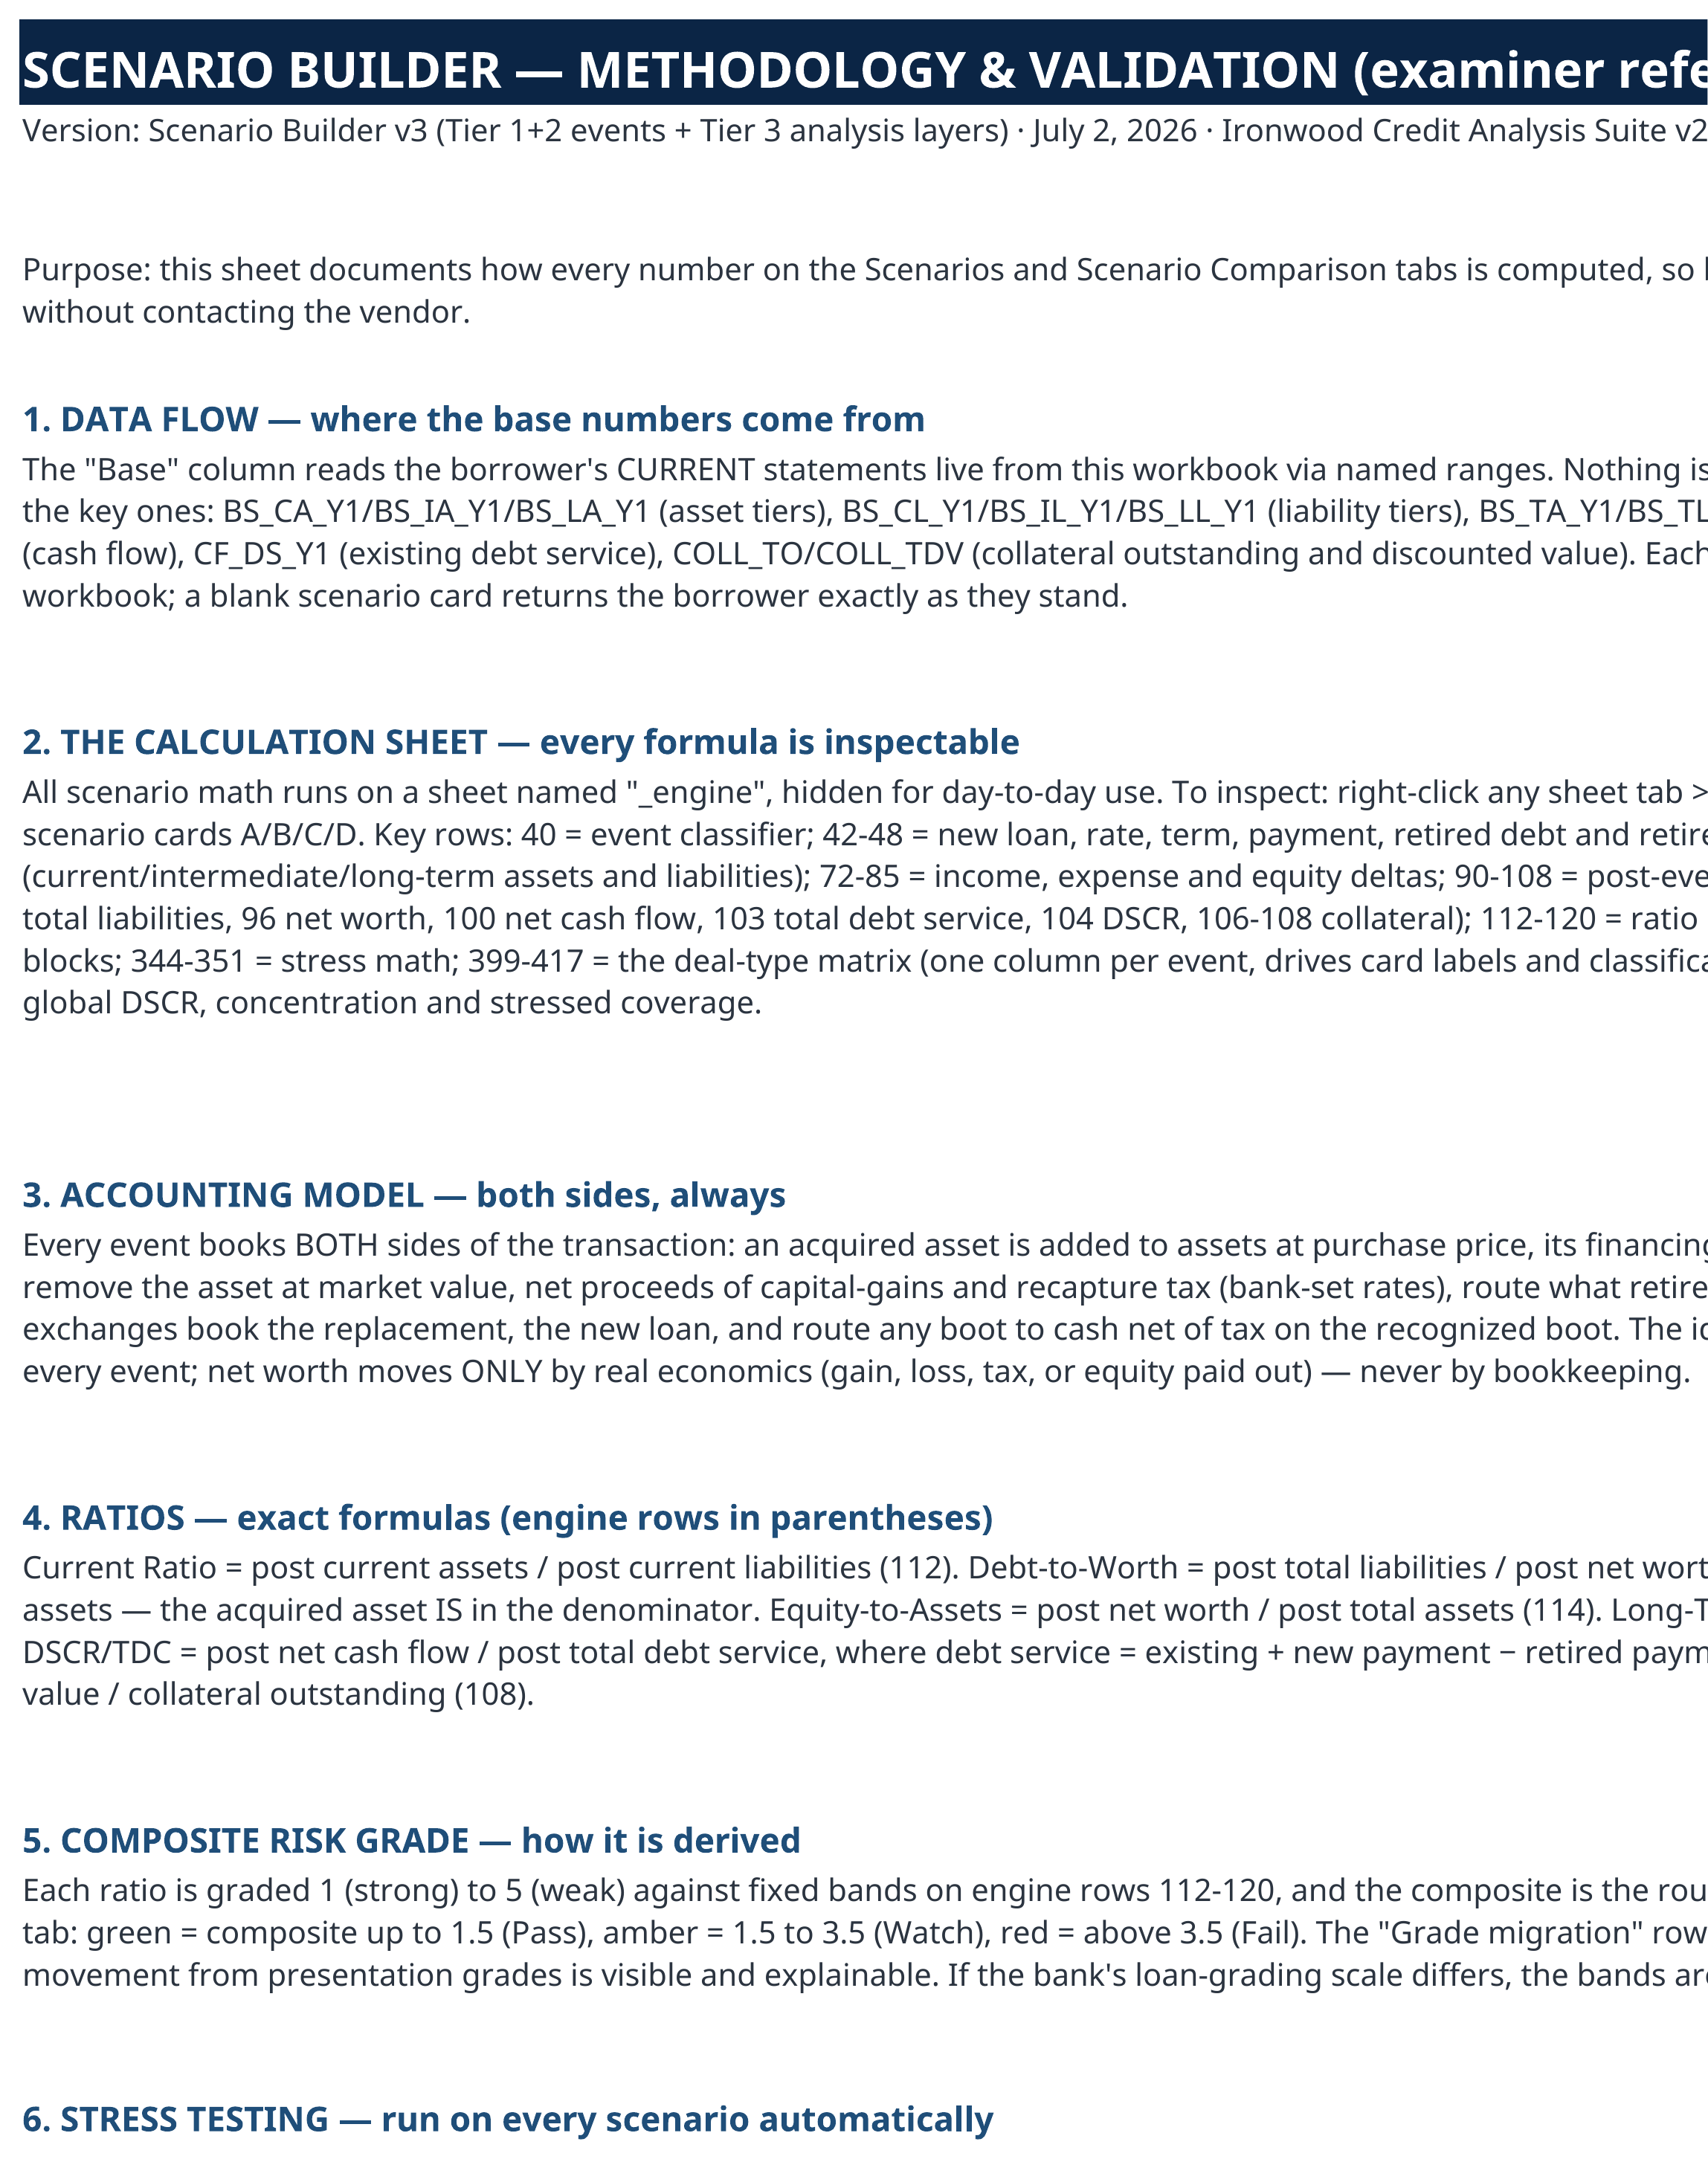
How a scenario is built
Three views of the same request
Compare
Scenarios lined up against the limits
Each column is a structure. Each row is a test. Green is inside the bank's policy limit, amber is watch, and red fails, so the shortlist is obvious before anyone builds a memo.
Explain
What moved between the versions
The sources and uses view reports the balance sheet change behind each scenario: assets added, debt added, and the resulting position. Nothing has to be reverse engineered.
Bound
The limits that still clear policy
Maximum debt and minimum position are reported for each version, which gives the lender a defensible number to take back to the borrower.
The index
What the scenario page reports
- 01
Multiple structures
Several versions of the same request, side by side.
- 02
Limit level scoring
Pass, watch, and fail for every test in every column.
- 03
Sources and uses
Assets added and debt added, per scenario.
- 04
Post loan position
Leverage, coverage, and working capital for each version.
- 05
Policy limits
The maximum debt and minimum position that still clear.
- 06
Shared limits
The same policy tab that drives the risk rating.
- 07
Committee ready
Bring two structures to the table instead of one.
- 08
Available in every workbook
Consumer, commercial, ag, and global.